A Computational Analysis of Women’s Suffrage in Historical Newspapers
本文由「A Computational Analysis of Women’s Suffrage in Historical Newspapers」的公开内容整理,完整内容与后续更新请点击文末链接阅读原文。
The QuestionIn what years was there the highest coverage of suffrage for women in California and New York between 1890 and 1920, and were the trends similar in the two states?
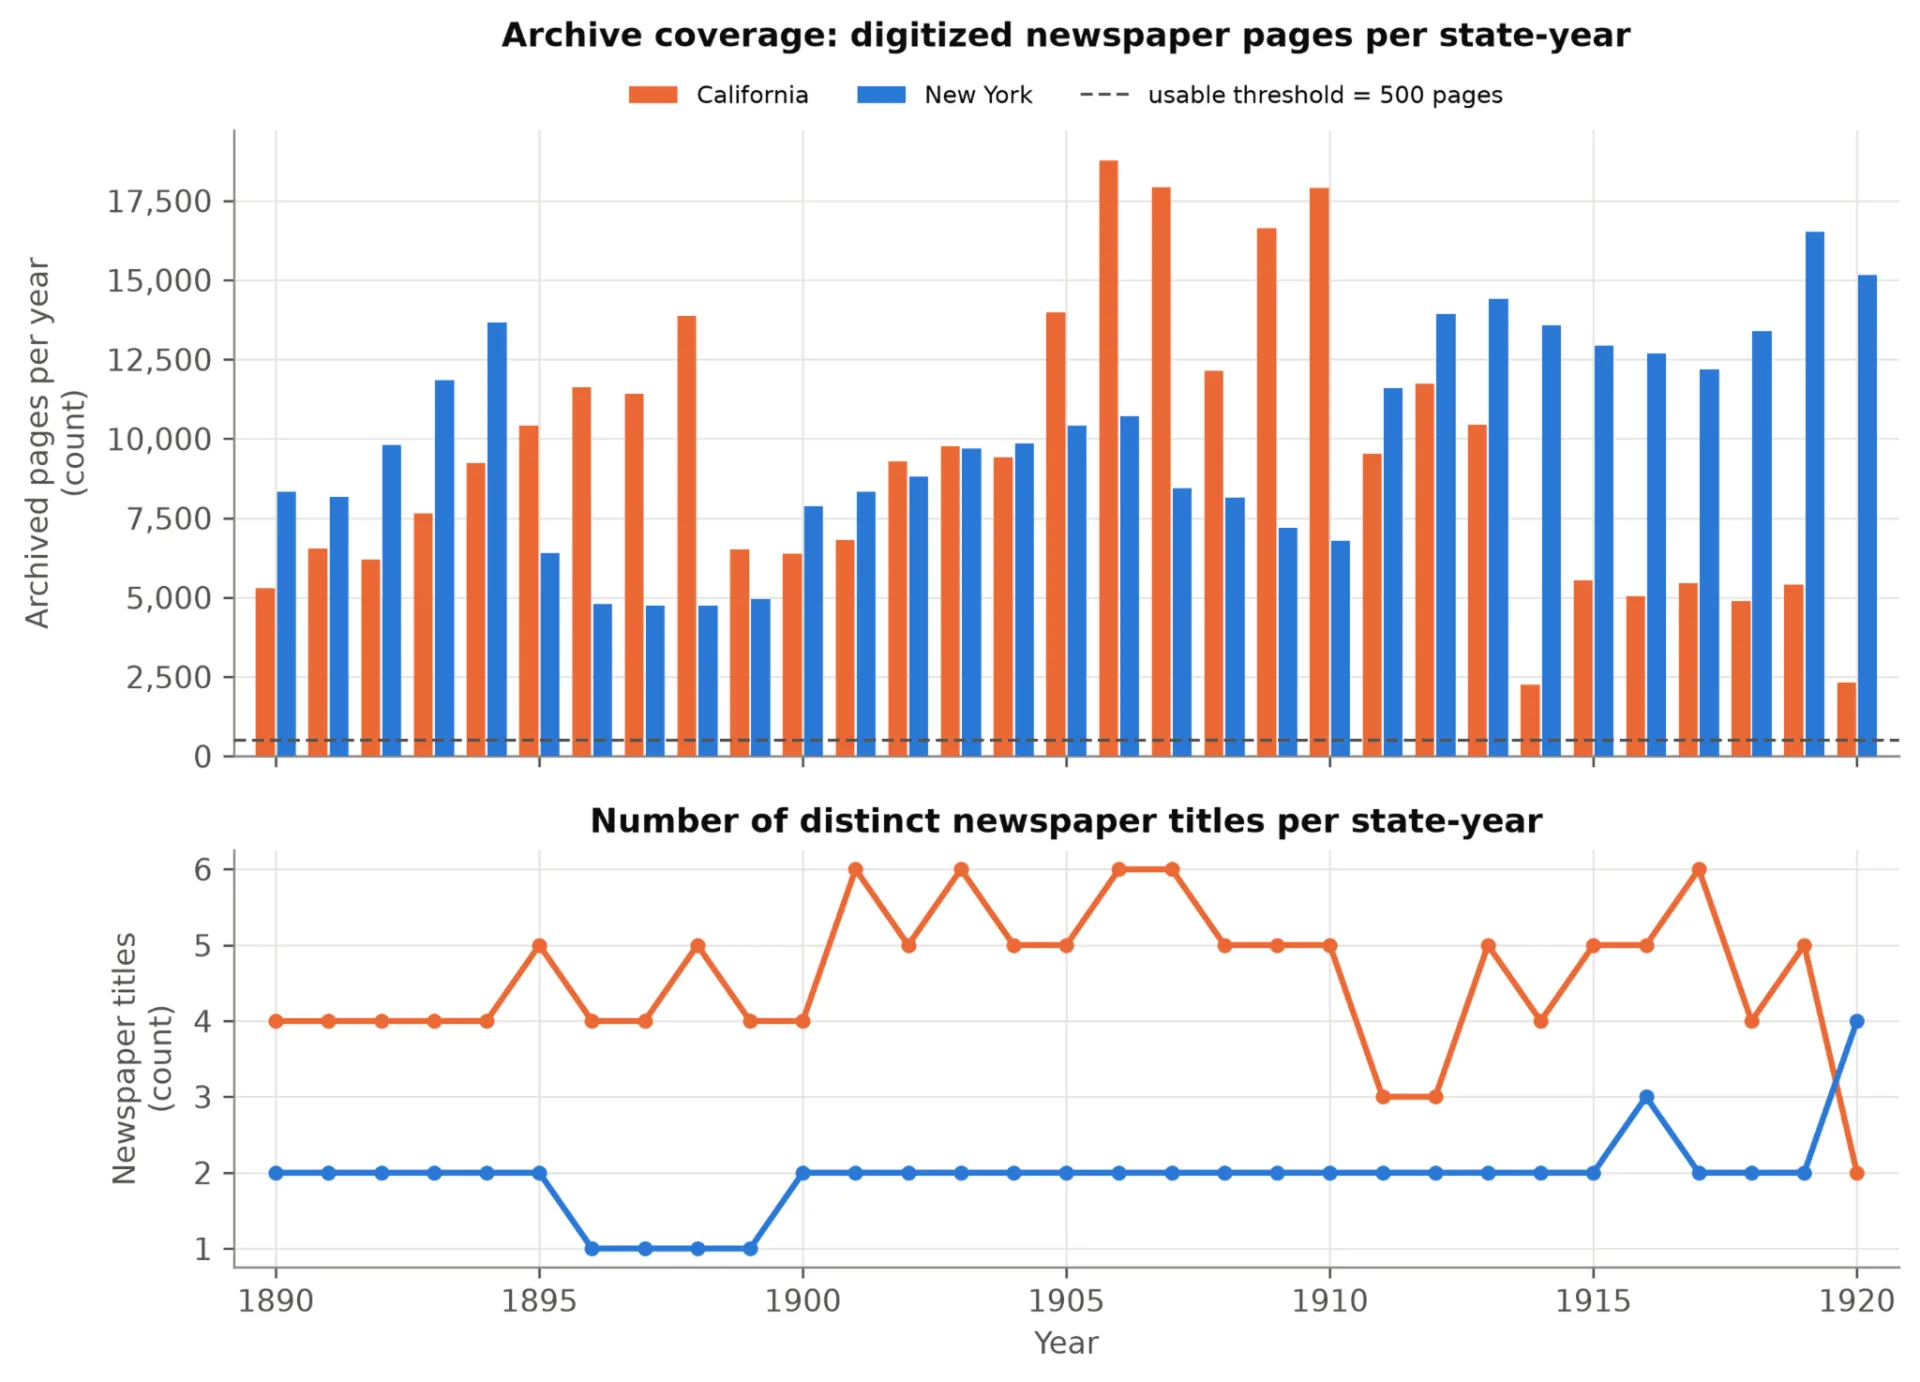
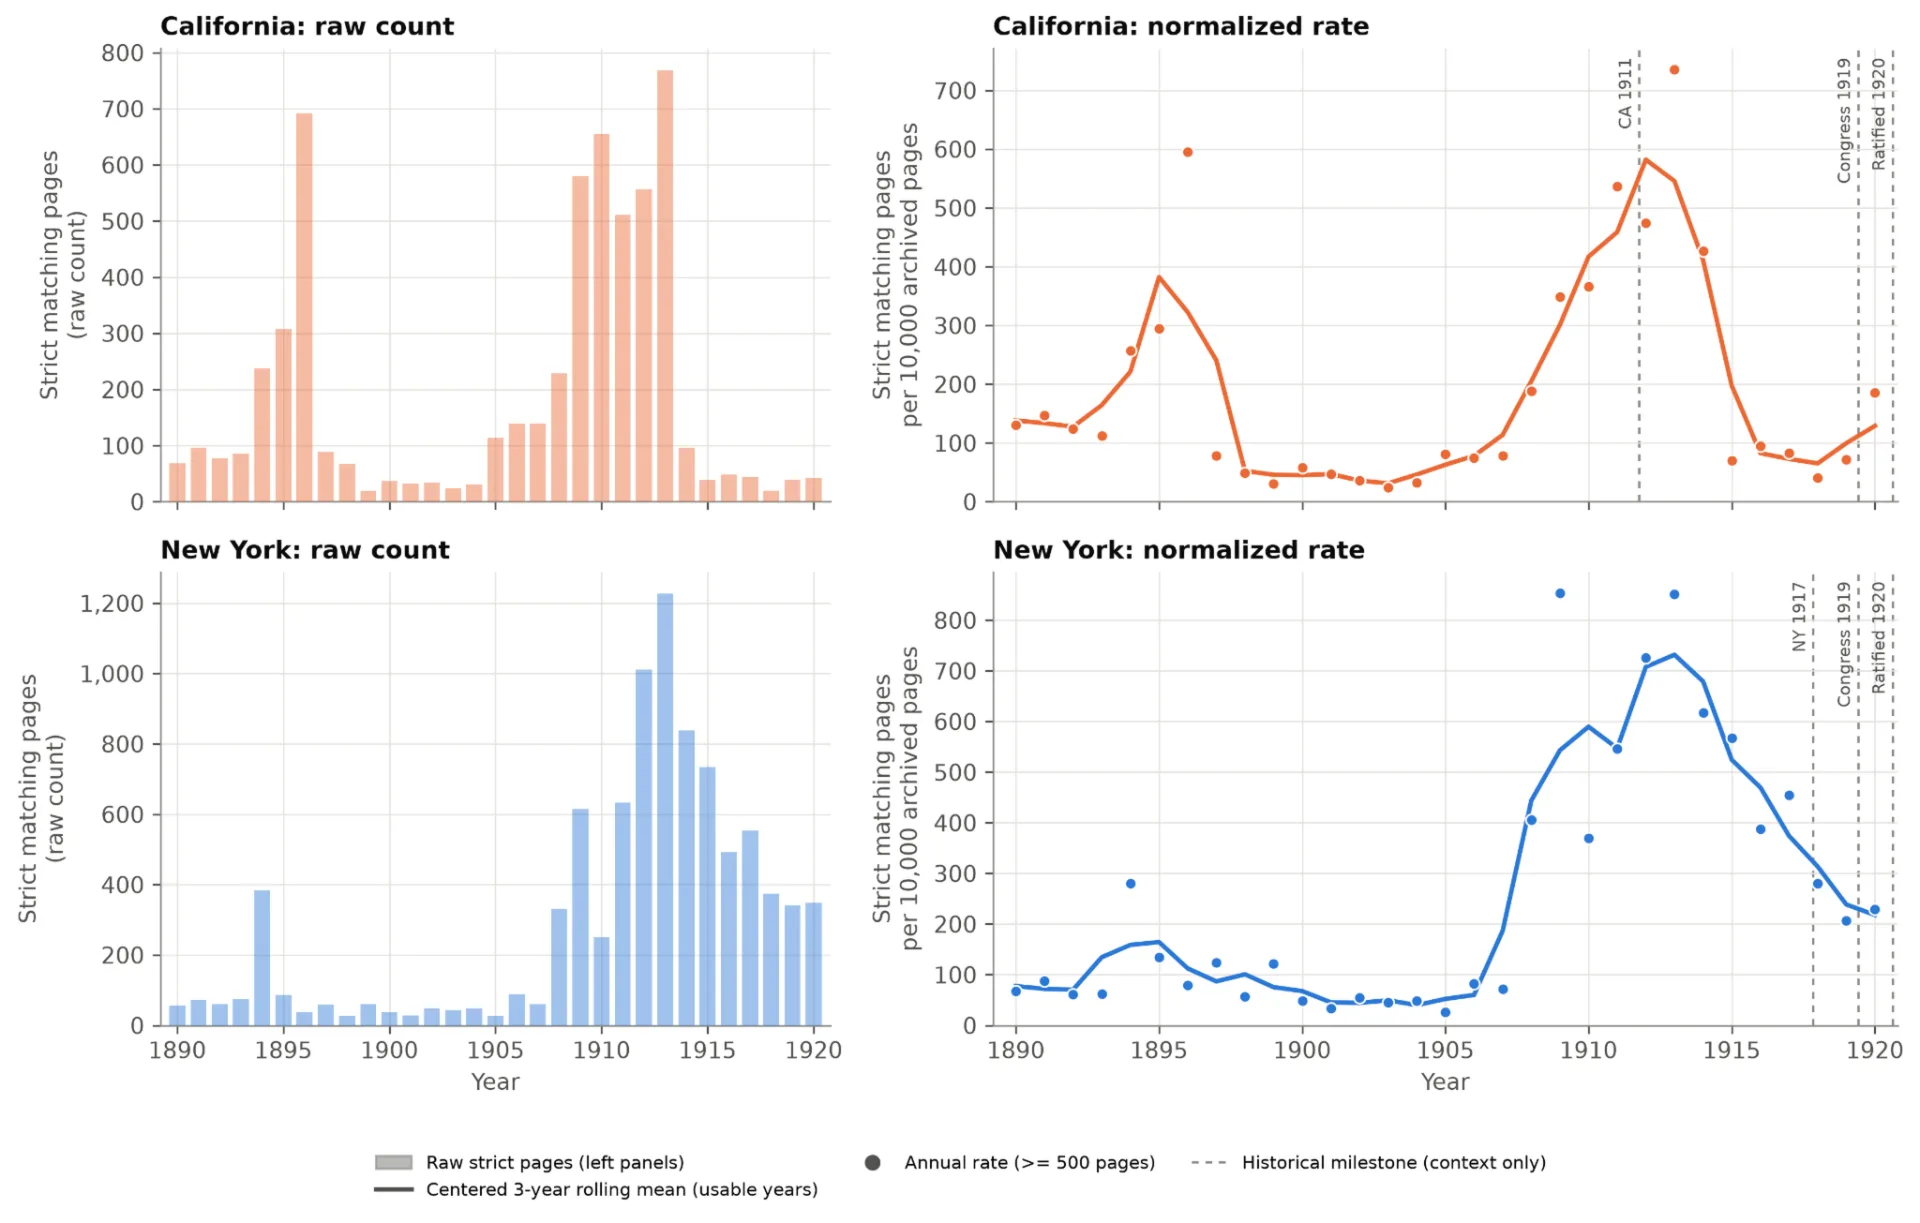
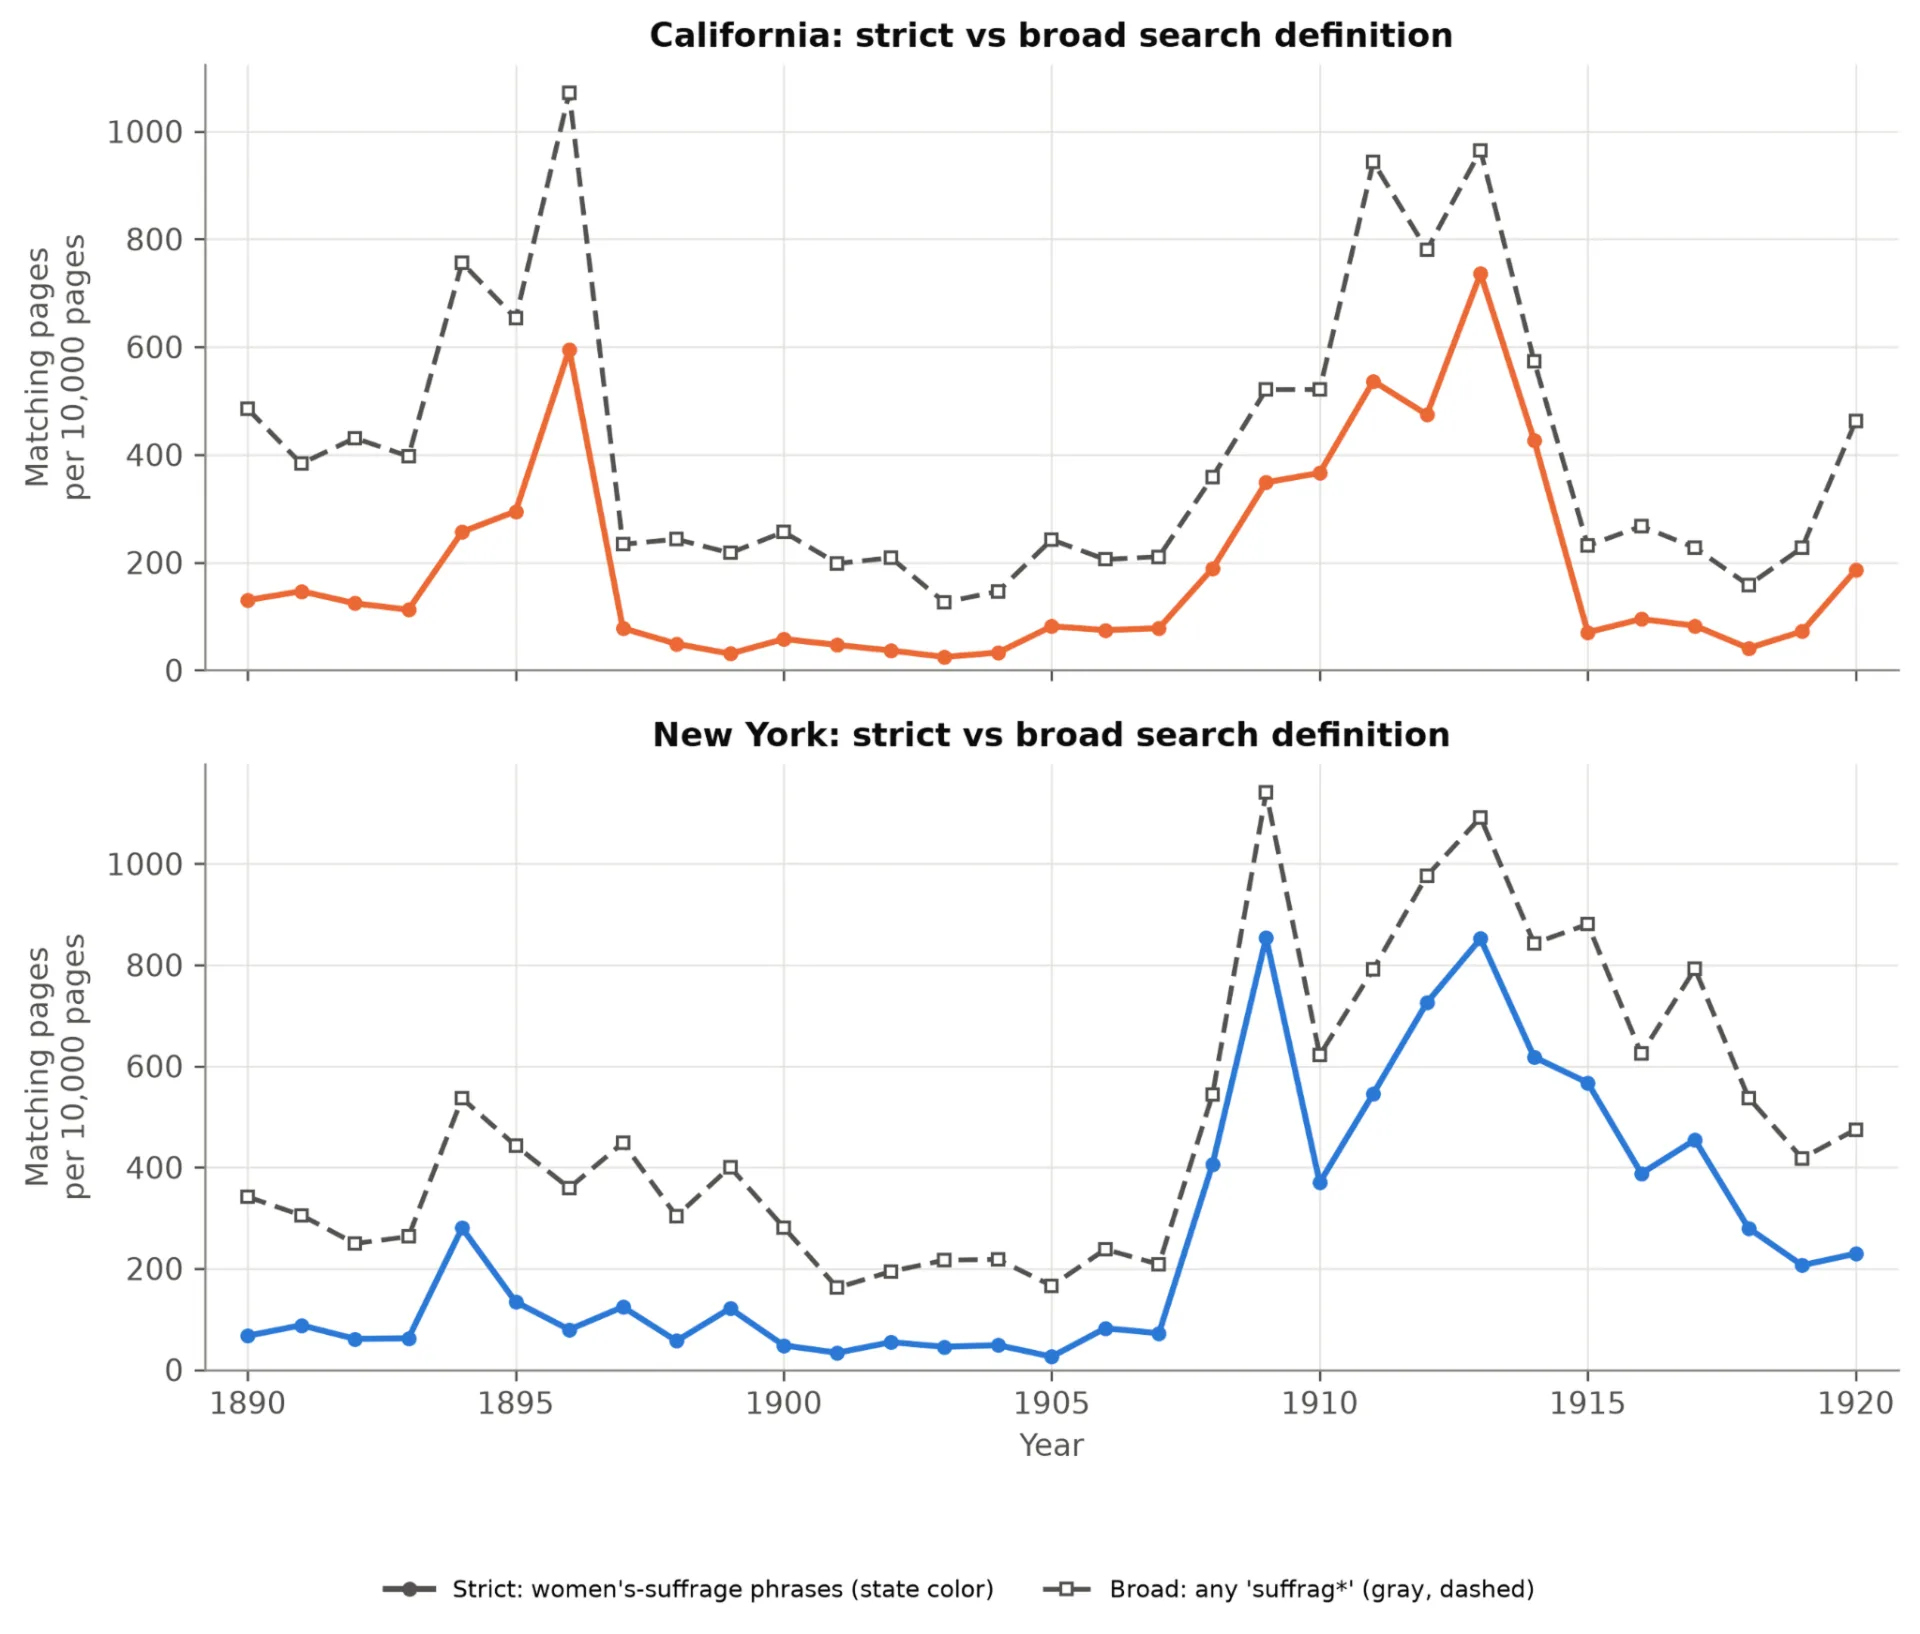
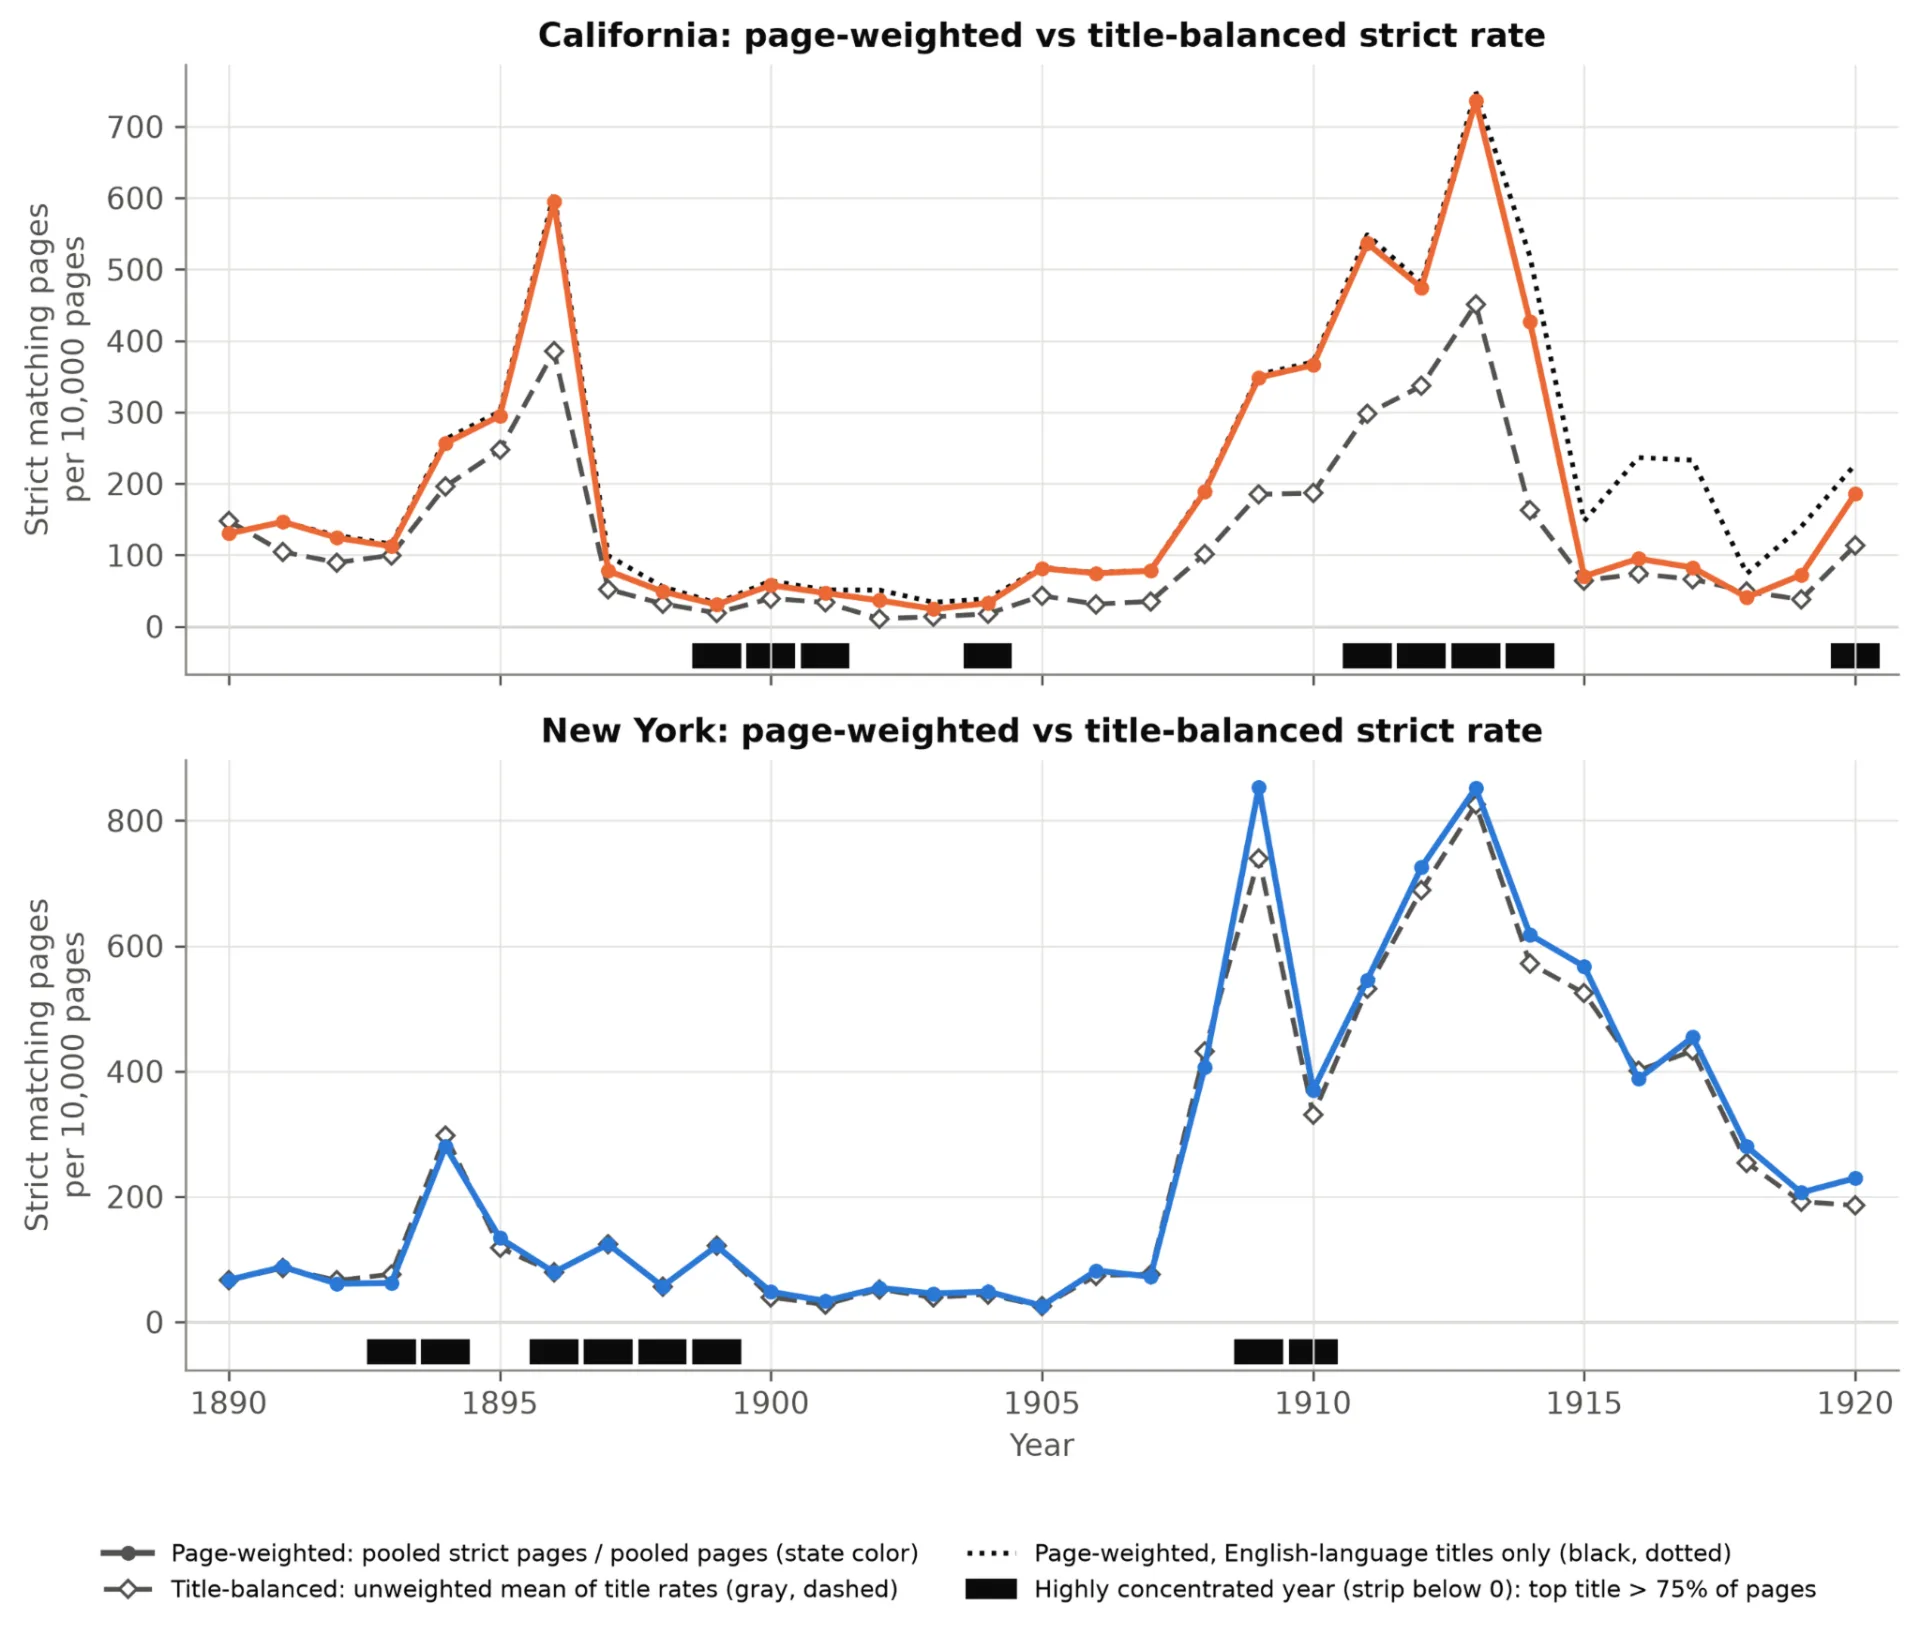
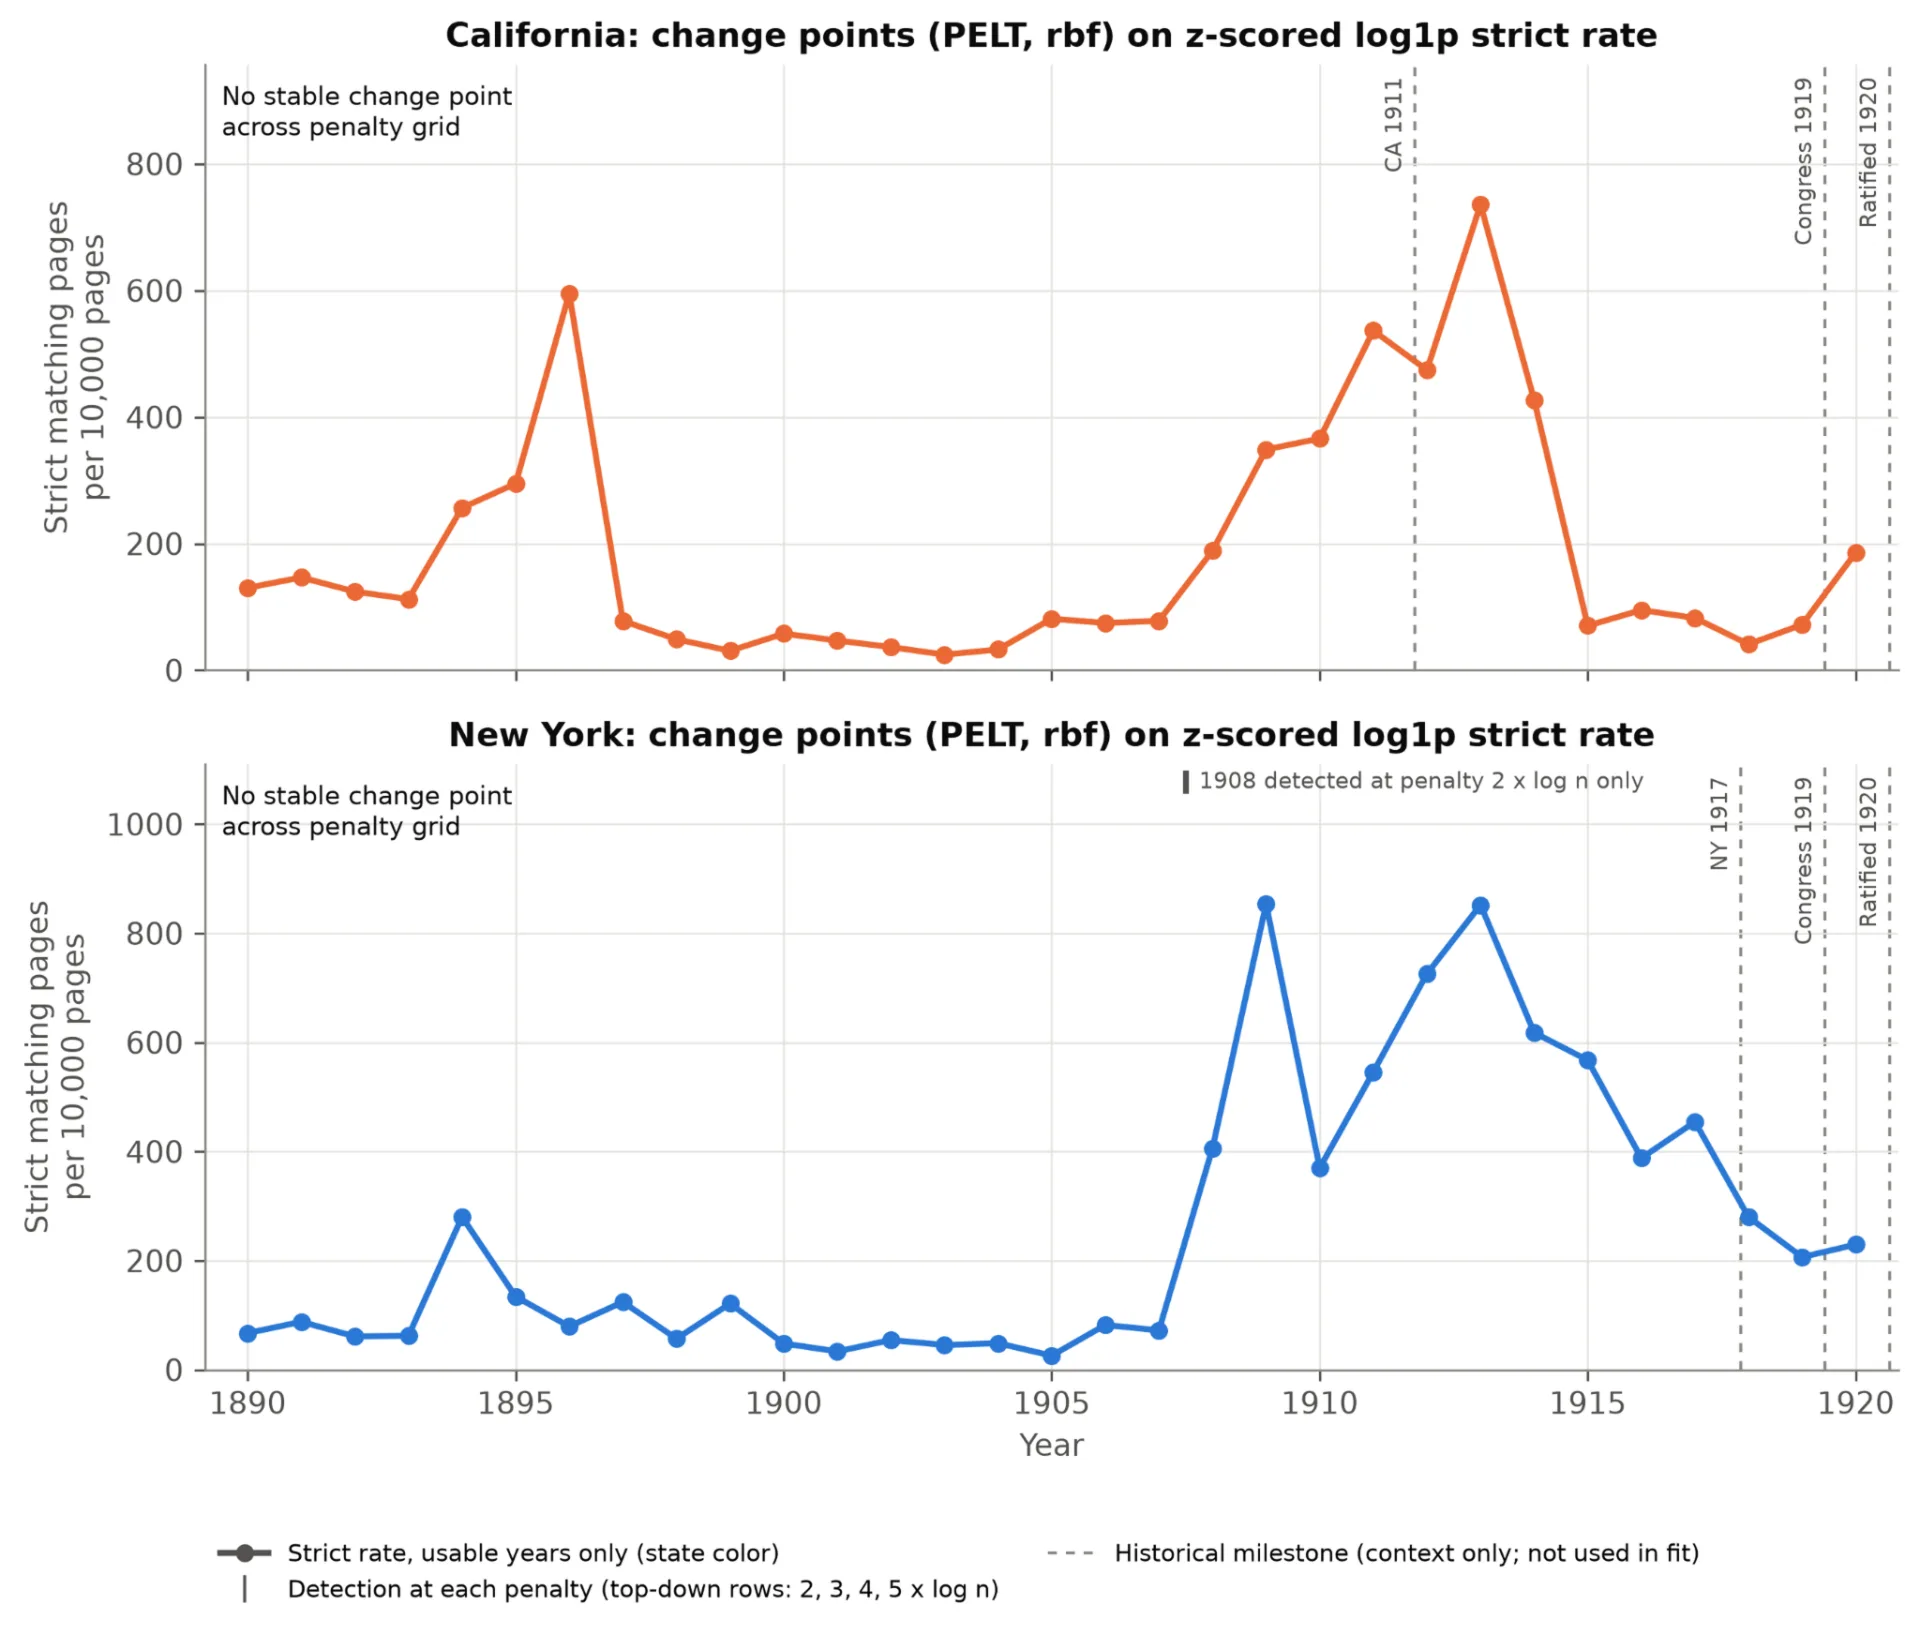
Both California and New York constitute useful grounds for historical comparison. In California, women's suffrage was introduced in 1911. In New York, a suffrage amendment failed in 1915 but passed in 1917. The Nineteenth Amendment was transmitted to the states in 1919 and became ratified in 1920.Though these dates serve as useful context, they are not used to guide the analysis process. While this task was originally seen as just a historical counting exercise, it turned into a wider problem of measurement.This problem can be seen to be relevant not only to the study of historical newspaper archives. Practitioners dealing with datasets have to contend with cases when their size, composition, language, and quality change over time. This may mean that an identified trend is due either to the change in the phenomenon under observation or to a change in the process of recording it.The dataset is not the populationThe data come from the Library of Congress’ Chronicling America database, retrieved through the Tim-Pinecone/LOC-Chronicling-America dataset on Hugging Face and licensed under CC0 1.0.Every line stands for an OCR’d page of a newspaper and includes data such as title, city, year, and other information. The Parquet files were retrieved remotely through DuckDB.The dataset includes 600,546 pages: 290,397 from California and 310,149 from New York.However, the archive cannot be considered to be a stable sample of the press.Five New York titles have been included throughout the time span, and in 30 out of 31 years, one newspaper accounted for more than half of the pages. There are 21 titles from California, but in no year have more than six titles been present.The bottom line is clear:The data describe the archive, not the whole newspaper press.Defining “suffrage attention”Unit of analysis: page.A page is defined as having at least one search term within it regardless of how many times it appears.The strict query uses six phrases:woman suffragewomen’s suffragefemale suffragevotes for womensuffragistsuffragette A broader comparison query searches for any occurrence of suffrage.There were 14,971 matching pages in the strict query search against 28,283 matching pages in the broad query search for the entire sample period.“Attention,” then, is the share of archived pages that include one of the above phrases. This measure does not capture the level of public backing. In addition to support, opposition, satire, ads, and news, any form of attention is captured in this measure.Why raw counts can misleadA raw count mixes up two different variables: (1) the number of pages that the archive has for that year, and (2) how often suffrage is found in these pages. An increase in the number of pages in the archive can bring up the number of matches even when the rate stays the same.It can be seen in the current data as well. There is a Spearman correlation between the raw suffrage-page count and the archive size for California and New York of 0.59 and 0.63, respectively. Once normalized, these correlations decrease to 0.17 and 0.38, respectively.It is very easy to see in New York. There are the most matching pages in 1913 (1,227), while the normalized rate peaks in 1909.There is the same problem in California. There are only 96 matching pages in 1914, but the archive itself contains only 2,248 California pages that year. When normalized, 1914 turns out to have one of the highest rates of attention.A more general lesson is that when dataset size changes over time, raw counts contain some information about the dataset size as well.Normalizing attentionThe key indicator utilized is:Suffrage Rate = (matched pages ÷ archived pages) × 10,000An index of 50 would imply one matched page in every 200 archived pages.While missing values were distinguished from zeroes, a zero means
本文基于 Towards Data Science 的公开内容,由 AI 辅助整理改写后发布。
原标题:A Computational Analysis of Women’s Suffrage in Historical Newspapers
阅读原文